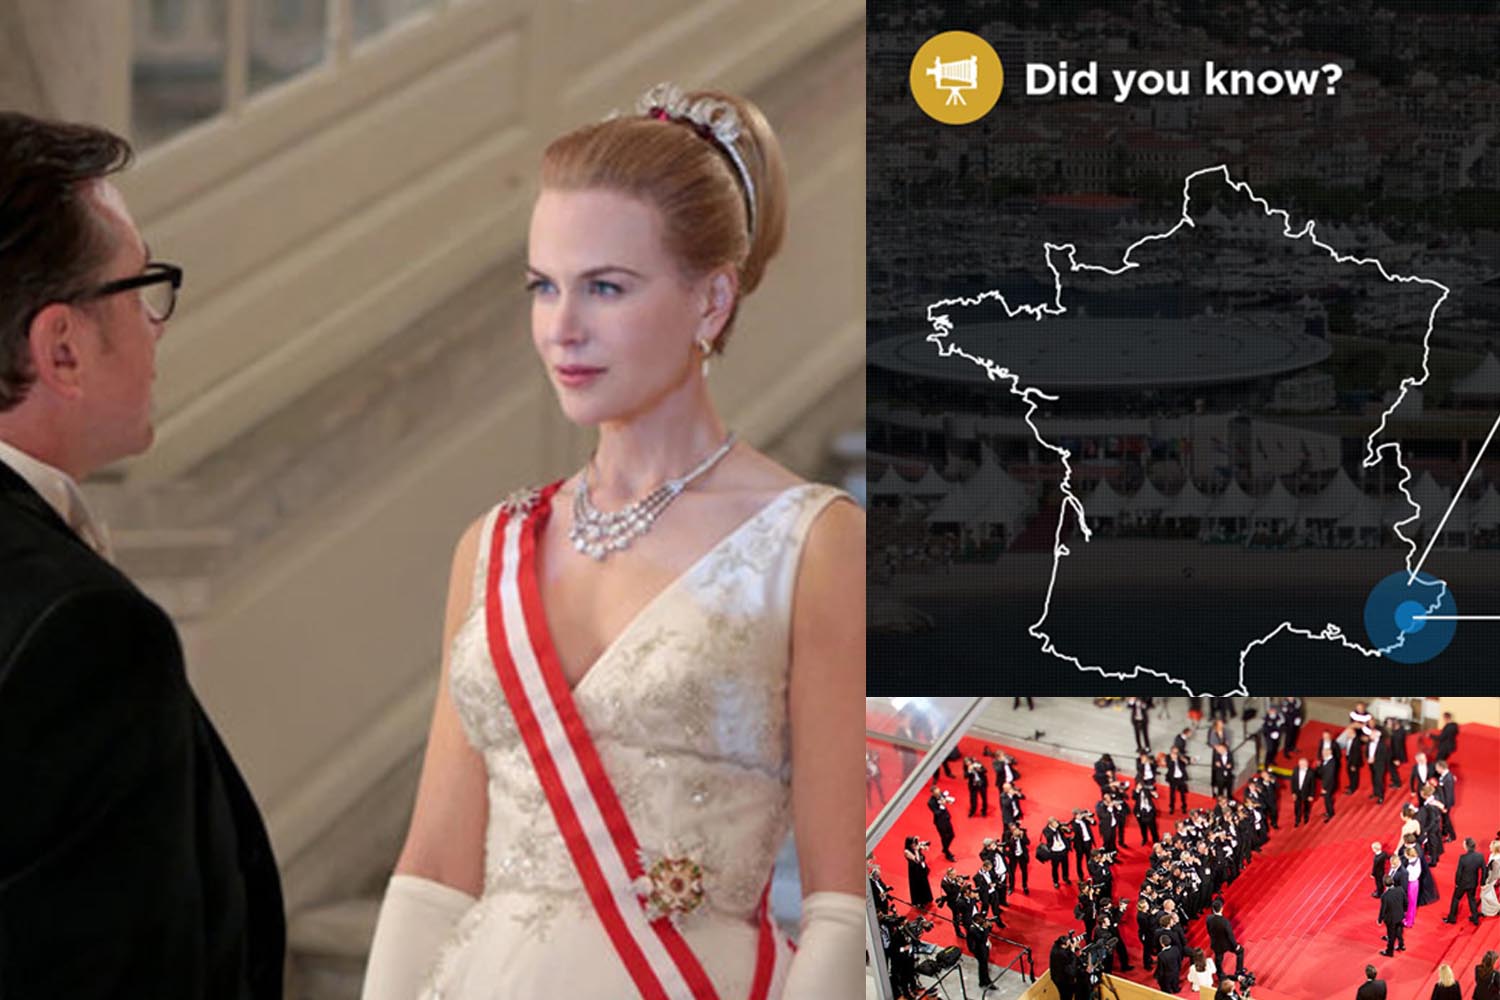
Crowd informs geeks and glitterati with an infographic produced in conjunction with Entertainment Media Partners and Screen International magazine.
Originally appearing in the special Cannes edition of the magazine, we produced an interactive online version that engaged film industry professionals and enthusiasts alike.
The print version of the infographic is viewable here.
Just like the festival, the site needed panache and glitter. Using JavaScript generated SVGs and CSS3 animations we were able to make it especially snazzy, and present data in a digestible way.
For hard-bitten producers and film geeks alike the site reveals who spends what, where and when. From box office takes to awards won, you get a vibrant snapshot of the global film market. Right down to the kilometres of red carpet used.
We’re great believers in doing our homework. Rummaging around the internet, we found a great variety of infographics. Here are some that inspired us along the way.
Example 1: Future of Car Sharing
The future of car sharing is an infographic that educates users on how car sharing has changed over the years. Viewers use the left and right arrow keys to navigate a car along the length of the infographic, revealing more information the further they drive.
How Search Works is an interactive infographic put together by Google themselves. Its aim is clearly identified in the title – to explain how search works. The infographic works by users scrolling down the page, which triggers the next set of animations to play. The visual animations can be a great aid for users to help grasp certain ideas.
Example 3: Don’t Drink and Drive
Don’t drink and drive is an infographic created to make people in Leeds and Manchester aware of the dangers of drink driving in their local area. We think that the interactivity of it is great - It allows users to select what they would normally drink at the bar, then scroll down to see if they would be over the limit.
13 reasons why your brain craves infographics was created by infographic design agency Neomam. It informs users of the benefits of infographics as a method of displaying data, and why people are so willing to engage with them. The use of animation along with bright and clear colours is engaging and keeps viewers interested.

